Everybody knows metrics are important for product managers. The key is using the right data to inform and influence your product decisions and avoiding bad data like vanity metrics.
There are 3 types of data: The good, the bad, and, yes, the ugly. In this three-part series, I’ll explain each one of these, culminating in how to measure for outcomes (aka, The Good).

Let’s start off with the bad — Vanity Metrics
What are vanity metrics? They’re a way of measuring something without context, they are easily manipulated, and they do not lead to actions you can take to grow your business. Examples of vanity metrics include app downloads, page views, time spent on a website, twitter followers, facebook likes, etc.
The number of times your app has been downloaded does not provide a direct correlation to how successful your business is. If a million people have downloaded it, but only 1/10th are using it, that’s not good. Same with page views. Just because your website has lots of traffic does not mean you have a successful business.
Companies must properly measure the right data so that they can get a handle on the true health of their business.
Tweet
If you focus primarily on vanity metrics, you can get a false sense of success by focusing on metrics that might make you feel good, but don’t actually tell you how well your business is doing. This is an especially lesson for start-ups, which seem tempted to use vanity metrics because they haven’t quite figured out which metrics actually matter.
Let’s take a look at some examples of vanity metrics…
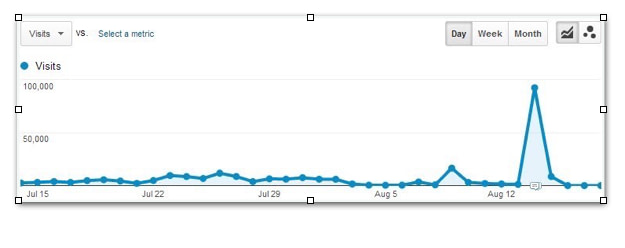
On this chart, it looks like something really great happened on August 14th. Wow, web traffic really spiked that day! The problem that many people make is attributing that solitary spike to an action they took directly preceding it. Multiple people at their company may have done something that resulted in the spike. There could even be external events that caused the spike. The key takeaway here is if this spike didn’t lead to the company’s bottom line by generating revenue, it’s useless.
Speaking of useless, this entire page is useless!
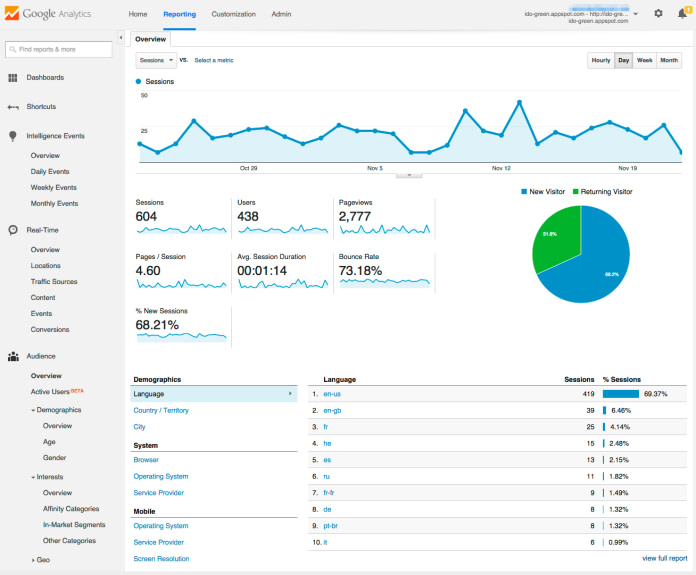
Many product managers use Google Analytics. But if you use their default dashboard, pictured here, there’s nothing you can take action on based on these metrics! The thing to remember is that you should customize your dashboard to focus on the metrics that measure how well your product is achieving key outcomes. Data points such as the number of users, page views, and average session duration don’t help you measure what’s working. And you can’t improve what you’re not effectively measuring.
If you are new to the world of product management and concerned that you don’t know good data from bad data, consider getting product coaching. For more info, click here.
Join me next time for the second post in this series where I’ll discuss “The Ugly” metrics. As often as product managers talk about making data-informed decisions, it’s amazing to me how often data is presented in ways that are completely misleading or downright wrong. I’ll help you avoid some classic mistakes. You won’t want to miss it!
Sign up to receive an update when I post my next blog article!